
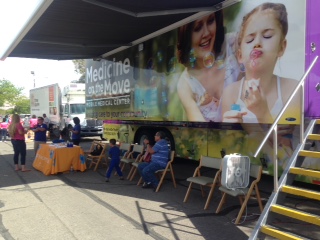
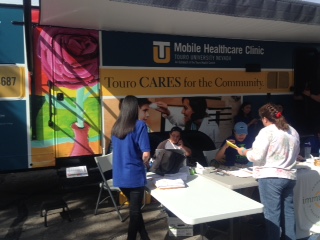
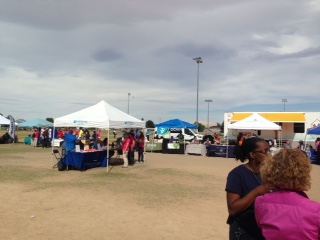
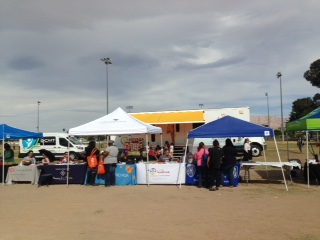
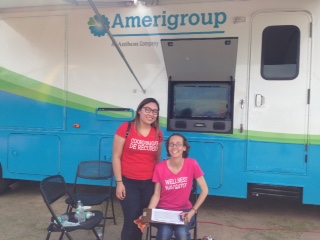
MHC Hartke Park Re-Cap
- lasvegaschipsinfo

- Apr 6, 2017
- 4 min read
RESULTS
Four data sets were collected and reviewed. First was the main demographic and disparity data collected from the survey; the data set has approximately 150 participants. Second was additional data gathered from a smaller subset of participant (approximately 30-45 people). Significance must be considered when looking at this data. The final data set collected from this event represents the multiple choice and open-ended questions. The analysis for this final data set was performed by Ying Zhang, Senior Scientist and Salomon Compare, Epidemiologist both at the Southern Nevada Health District (attachment2). To improve cohesiveness, the event data is compared to readily available zip code level census data (table 1). Review of the data is through grounded theory to define and understand community themes, and emerging issues.
DEMOGRAPHIC DATA
There were 156 family units that registered for the Hartke Park Event. The events potential reach was 744 people (total number of members in the 156 families). Almost 1/3 of the participants were adults aged 35-44 (n=51). This was followed by those aged 45-54 (n=31). Most participants were female (n=110). The main ethnicity reported was Hispanic at 71% (n=111). It was noted by providers less than half spoke English.
HOUSING
Housing affected the community in multiple ways. Unstable or subsidized housing affected 41% of participants (n=49). Their housing solutions included staying with family or friends (n=13) or relying on a housing subsidy, 21% (n=25). Of the participants, 44% (n=62) were living in a two-parent household. In the subset data, just over 1/3 who responded stated they were homeless (n=9) or in imminent danger of losing their home (n=3) (attachment 2).
The multiple choice and open-ended questions showed that housing concerns were a cause of poor to very poor quality of life. Participants who responded that their quality of life was poor to very poor 6.74% (n=6) reported that housing issues 75% (n=3) may be the cause (attachment 2).
Census data shows that 30% of the population in this area claim homeownership and 60% pay > 30% of their income towards rent (table 1).
INSURANCE
Lack of insurance coverage appeared to be a major issue in this community with only 43% (n=60) of participants stated they had insurance (attachment 2). Of these, 43 asked to be contacted for follow up assistance with insurance sign up. Limitations of data collection did not allow differentiating between coverage for parents and coverage for children. The open-ended questions suggest that the inability to afford healthcare was a major barrier in attaining healthcare. Zip code level census data shows that 57% of the 89030 population have insurance (table 1).
ACCESS
There was no demographic data related to access to care. The majority of survey participants reported getting healthcare in clinics 38.5% (n=35) and hospitals 30% (n=30). There were no specific trends explaining why participants chose where they get their healthcare needs met. It is noted in open ended responses that participants mentioned feeling they received better, faster, and more convenient care from the hospitals and clinics. When discussing barriers to healthcare, 49% (n=34) of participants stated no reason. This was followed by
39.1% (n=27) stating they were unable to afford healthcare and 8.7% (n=6) stating that their illegal status was a barrier.
CITIZENSHIP
The subset data showed 12 out of 35 participants were not citizens while the remaining 23 claimed citizenship. This may be relevant when reviewing the additional multiple choice data and how they access care.
INCOME
There was no income demographics collected from the main data. The following data are from a very small subset of participants and accuracy must be considered. Of this subset, low income was extremely evident. Only 29 participants reported their household income: 22 (76%) stated they made $0, 4 stated they made between $1-10K, and 3 stated they made between $10-20K. Zip code data shows 34.8% of families and 50% of children living below poverty in this area (table 1).
QUALITY OF LIFE
This was a multiple choice and open ended question that asked the participant to rate their quality of life from very poor to very good. Open ended options were available if Quality of Life was ranked as poor or very poor. There were 89 participants who responded to this question with 60.68% (n=54) stating that their quality of life was good or very good.
DISCUSSION, RECOMMENDATIONS
Overall this data agreed with the census data. It is interesting, however, to note that 60% (n=54) of participants stated that their quality of life was good to very good in spite of the large disparities. It is important to note their primary concern mentioned was housing. This is important as community change and improved decision-making is more likely to occur where there is trust, engagement and a sense of community, a trend that appears to be more evident in lower income communities (Kelly, B. 2017; Barnes, M. and Schmitz, P. 2016). Although not captured in the data, the collectors discussed participant statements such as, “I don’t have an (access) problem; I just go to the hospital”. In the open ended questions, reasons they went to the hospital included, “better”, “faster” and “convenient” care. This may be important when considering how to increase trust in the community and provider home.
This data showed that there is a high need for assistance in this neighborhood to increase access to healthcare. This is most notable in the need for housing, followed by insurance, and access to care inclusive of medical, home, and other facets and then income. To improve our reach to these communities and families we need to ensure a “warm handoff” or continuity of care with a heavy focus on establishing trust. There also needs to be a complete follow through with interventions. This can be accomplished through improve data collection, shared data bases (H/CMIS), and global case management. The Mobile Health Collaborative should engage in group discussions to decide on the validity of recommendations the strongest plan for addressing these recommendations moving forward.


Comments